📅 Posted 2018-10-04
This is a partially-baked idea, so be warned. But I really wanted to get this out there in writing, mainly to see how the idea unfolds. Since thinking about this quite a lot, I’ve only seen a couple of other examples of it in the wild and I’d love to take it beyond being theoretical.
You may have heard of Infrastructure as Code, described as:
Infrastructure as code (IaC) is the process of managing and provisioning computer data centers through machine-readable definition files, rather than physical hardware configuration or interactive configuration tools. It can use either scripts or declarative definitions, rather than manual processes, but the term is more often used to promote declarative approaches. (Wikipedia)
Infrastructure as Code is pretty awesome: you can declare an entire system of servers, routers and databases and then click a button to deploy the whole lot. And of course you can do much more than that. I’d like to be able to do the same for Analytics, hence Analytics as Code.
Stick with me on this one, it’s going to be a long one.
But firstly, why?
Doing Analytics on websites and apps is tough. I’m talking beyond throwing a Google Analytics tag on a page and getting Page Views because this only gets you so far.
Often, this means putting some code like this on your site:
(function(i,s,o,g,r,a,m){i['GoogleAnalyticsObject']=r;i[r]=i[r]||function(){
(i[r].q=i[r].q||[]).push(arguments)},i[r].l=1*new Date();a=s.createElement(o),
m=s.getElementsByTagName(o)[0];a.async=1;a.src=g;m.parentNode.insertBefore(a,m)
})(window,document,'script','https://www.google-analytics.com/analytics.js','ga');
ga('create', 'UA-00001337-1', 'auto');
window.onload = function() {
  ga('send', 'pageview');
};
Sample code snippet to activate Google Analytics on any given website
If only all analytics implementations were this simple! And I apologise if this doesn’t look simple, but if you can master CTRL+C and CTRL+V then you too can make it work.
Getting the right widget tracked in the right way so that you can make more informed decisions with data you can trust is an art.
You’ve just added a new feature, is it actually doing any good? Should you continue to invest? Does nobody care and you should remove it? Who is your audience anyway? Where are your gaps and opportunities for new markets? And then many more questions.
Transferring the knowledge from business need, to data scientist, to developer, to QA, back to data scientist and back into some sort of understandable chart isn’t easy. Sure, you could cut down on some of those steps in a smaller company, but life isn’t always that easy.
I’ve been hunting for a way to describe metrics and how they can be sourced from user behaviour for a while. I’ve written my fair share of Confluence pages over the years and it works to a point. It sort-of explains what is required by the devs and it sort-of explains why we’re doing it. But it has many drawbacks, which I hope to get it in this article. There are many people who would benefit from the detail captured in different ways: everyone has a different need.
A few Google searches for capturing analytics requirements will only return unwieldy templates built out in Excel as if you were doing Business Requirements Documents from 2002. Not good enough. I want something far more ambitious.
The question I have is:
If you can define your cloud infrastructure using code (declarative) ala Infrastructure as Code, why couldn’t the same technique be applied to analytics?
Analytics?
It’s a way of measuring behaviour in digital products to better inform business decisions. Think: trackers, cookies, collectors, data warehouses, that kind of thing. Yes, often it can be creepy in the Ad Tech world, but also it’s essential when it comes to justifying important decisions. There are ways to keep things private (and respect DNT or Do Not Track settings in browsers) but sadly this has been much destroyed over the years by shady practices in Ad Tech. That could deserve a whole ’nother article, so I’ll park that and instead move back to the idea at hand.
When done right, analytics is invaluable. When done wrong, it’s a disgrace.
This is a reasonable definition of a subset of Analytics which I’m writing about here, called Digital Analytics:
Digital analytics is a set of business and technical activities that define, create, collect, verify or transform digital data into reporting, research, analyses, recommendations, optimizations, predictions, and automations. (Wikipedia)
What is Analytics as Code (AaC)?
Analytics as Code (AaC) is the process of managing and provisioning user behaviour event tracking through machine-readable definition files, rather than requirements documents. It’s a is a way to describe all aspects of user behaviour events from the why (KPIs) down to the implementation level (triggers, mappings, targets and contexts).
It describes, the what, why, how and where of analytics implementations in digital products on platforms such as websites and apps.
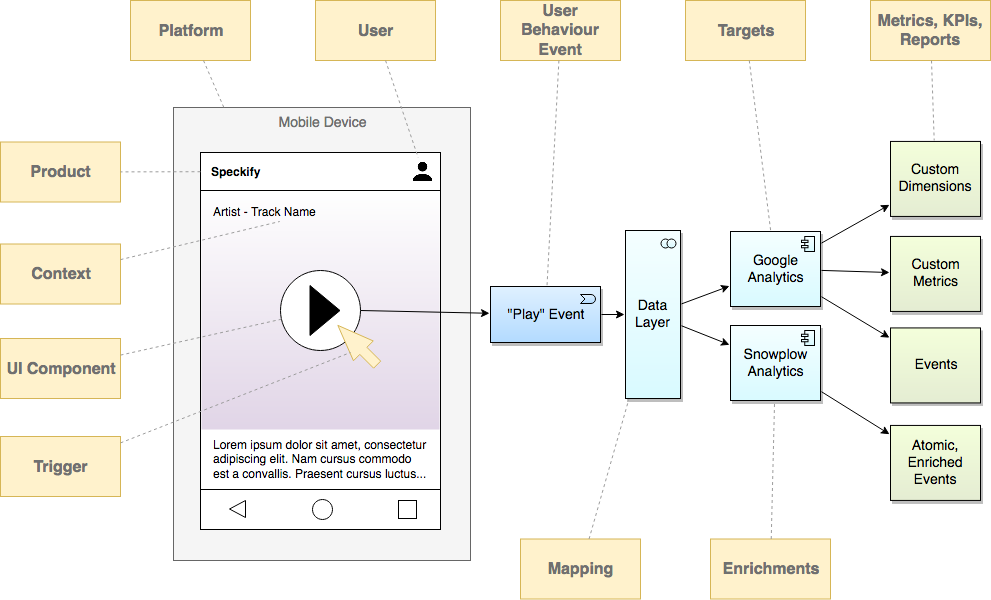
I’ve been thinking about this for a few months now. Here’s probably the easiest model I could come up with, and yes, it involves a diagram:
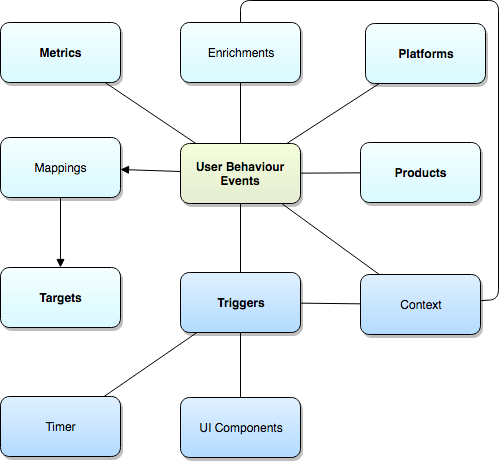
This model depicts different relationships of information to each other, with the centre being how User Behaviour events are the connection to everything else. Here’s a closer look at each of the elements.
User Behaviour Events
User Behaviour Events covers pretty much anything the user can do (and sometimes the things they don’t explicitly do, too). Some examples could be a tap of a play button, a share of a video, scrolling down a page making certain content visible, the use of a widget, completing steps of a checkout process in an online shop. There are many examples and they all tie to the rest of the concepts described below.
Metrics
This is what should be reported that drives business decisions and outcomes. Are we doing a good job? How does this month compare to last month?
Products
Some organisations have multiple products, but in this model I’m defining a product as a broad service offering, rather than an individual item that could be purchased among a sea of products.
So more like “Monthly audio streaming service” rather than “I bought this cactus but next time I’ll pick up a sunflower”.
Mappings & Targets
In a lot of places, Google Analytics is enough. But other orgs demand a little more than this and I’ve seen cases where a single page has 16 trackers. That’s the extreme case and there are better solutions, but let’s just say you’ve got a handful of analytics packages for different purposes, so they are different ’target’s for the events. Each of the targets has different requirements and may require specific events being sent to them. For example, you might want to use Google Analytics for high level numbers, but something like Snowplow Analytics for low-level all-the-things data.
Mapping is also useful here to make sure there is a translation between what’s captured and what each target analytics package requires.
Platforms
We live in a world where a product cannot simply exist on a single platform for long. This describes websites vs mobile apps vs car things vs smart speakers vs TVs vs what-have-you.
Triggers: Timer & UI Components
There are different reasons for an event to occur. Sometimes it might be user-initiated. Sometimes it might be be after a period of time has elapsed. Sometimes it could be scroll related, or something else appears in view. That’s great for measuring conversion rates. Or it could be a case of a video player reaching a particular milestone on a live stream or piece of on-demand content. This is always tied back to a specific UI component, which, you would hope, has a standard name used liberally across varying platforms.
Context
Context is an amazingly overused word, but in this circumstance I use it to capture any “additional” information about the event which isn’t captured elsewhere. It could be a bit of a catch-all, but it ensures that specific dimensions in target analytics packages can be supplied with appropriate values.
Enrichments
Enrichments are value-adding bits of transformation along the way. As part of the event being captured, what if we were to convert some data to make it even richer? A great example is converting an IP address to an organisation’s name or a user’s approximate location. Or both. The source and logic of these enrichments should be recorded.
Show me an example
Let’s say you have a digital product which allows users to search, stream and buy music online. You may have used this app yourself. I’m going to call it Speckify, after the great ABC TV show Spicks and Specks.
Speckify has a web presence as well as being available in both iTunes and Google Play. The business intends to expand into other markets, such as connected homes and car entertainment, but isn’t quite sure at this stage because of reliable data to support qualitative research.
One particular feature (among many - I’ll stick to one for this example) could be the ability to preview a song before purchasing it. The user can browse the catalogue and press a “play” button. The song will then be streamed and played on the device.
Let’s just take this one event, even though there could be many events leading up to the “play”. I’m going to try and paint a picture to illustrate the situation:
We’d love to answer important businessy reporting questions about which types of music are most popular, so the catalogue of music that’s on offer can be tweaked to suit user needs. Or perhaps work out what drives people to buy songs in the first place. Or run experiments to see how more sold can be sold over time.
Perhaps the “play” event can be one (small) piece of the puzzle to answer any of these questions.
You could come up with a model such as:
Event: Play
| Property | Value |
|---|---|
| Internal Name | play |
| Data Layer Event | events.play |
| Description | Occurs when a user initiates play of an on-demand audio clip such as a music track by an artist. |
| Trigger | When the media starts playing, so when the user clicks the play button or content is autoplayed upon open. Event triggers before advertising starts (if applicable). |
| Trigger Type | user-initiated |
| Content Types | audio/* |
| Platforms | web, iOS, Android, Google Home |
| Sources | Audio CMS, Echo Nest |
| Attribute Classes | user, audio, stream, lyrics |
| Metrics | plays |
| Targets | Google Analytics, Snowplow Analytics, Custom Pixel Tracker 1000 |
| See Also | Share, Like, Buy |
| Notes | This is the first rough draft of the ‘play’ event. We expect it to change over time |
A simple “play” event has a lot of aspects about it that could be defined more discretely with a lot more detail in linked attributes. The notes I have above don’t really scratch the surface of what’s required to actually track such an event.
So then…
You could expand and declaratively write this as a block of JSON. I’m quite aware that JSON has it’s flaws and it should be enough to mock an example, but this time I’m going to try out some TOML instead.
TOML I hear you say? Well it’s [Tom’s Obvious, Minimal Language(https://github.com/toml-lang/toml).
Warning: This is a long file, please scroll
# EVENTS
[events.play]
Name = "Play"
DataLayerEvent = "events.play"
DataLayerTag = "Media Events - Play"
DataLayerFolder = "media"
Description = "Occurs when a user initiates play of an on-demand audio clip such as a music track by an artist."
TriggerDescription = "When the media starts playing", "so when the user clicks the play button or content is autoplayed upon open. Event triggers before advertising starts (if applicable)."
TriggerTypes = ["user-initiated"]
ContentTypes = ["audio/*"]
Platforms = ["web", "apps", "google-home"]
Sources = ["Audio CMS", "Echo Nest"]
Attributes = ["user", "audio", "stream"]
Components = ["button"]
Metrics = ["plays"]
Targets = ["ga", "snowplow"]
SeeAlso = ["Share", "Like", "Buy"]
Notes = "This is the first rough draft of the 'play' event. We expect it to change over time"

# PRODUCTS
[products.speckify]
Name = "Speckify"
Owner = "rick.deckard@example.org"
Events = ["play"]
GoogleAnalyticsID = "UA-00001337-1"
SnowplowAppID = "speckify"
Notes = "The greatest music app ever!"

# TARGETS
[targets.ga]
Name = "Google Analytics"
AllowPII = false

[targets.sp]
Name = "Snowplow Analytics"
AllowPII = true

# PLATFORMS
[platforms.web]
Name = "Web"

[platforms.apps]
Name = "Mobile Apps"

[platforms.google-home]
Name = "Google Play"

# ATTRIBUTES
[attributes.user.id]
Name = "User ID"
Type = "string"
ContainsPII = true

[attributes.audio.artist]
Name = "Artist"
Type = "string"
ContainsPII = false

[attributes.audio.track]
Name = "Track Name"
Type = "string"
ContainsPII = false

[attributes.audio.album]
Name = "Album"
Type = "string"
ContainsPII = false

# COMPONENTS
[components.button]
Name = "Button"

[components.albumart]
Name = "Album Art"

[components.text]
Name = "Generic Text"

[components.sharebtn]
Name = "Social Share Button"
The main goal is that this can be interpreted by a machine to determine what to track, if tracking is working and then help us humans understand what’s going on.
You just can’t get that out of a Word document or Confluence page, without much fooling around and many headaches. Additionally, you can generate a PDF from the above file if people still want something to use as reference.
What can make it complicated?
I feel like the complication sets in when you have a multi-dimensional problem space. Imagine this:
- The organisation has 10 products
- Each of the products are available on 5 platforms, some of which has development outsourced to other teams
- Teams are asked to implement analytics for KPIs, data science and marketing purposes
- That could mean 10 different trackers (yurgh I can hear you say, but unfortunately it’s reality in some organisations)
- Different user groups want detailed fidelity of event tracking in some trackers, but not all
- The same feature is available in multiple places inside each product, so this needs to be reflected in the data
All of a sudden you’ve got a thousand scenarios of complexity and things will get out of hand pretty quickly.
How is anyone supposed to understand what should be captured and why, what is actually captured and what needs to change?
OK, so you want to document things nicely, but again, why?
This may seem like a complication of something that doesn’t appear to be complex from the outset, but I think the analytics problem space can be super complex.
Apart from an approach to deal with inherit complexity, some of the other benefits I can see for Analytics as Code are:
- I can write automated tests for the event model, since a test could understand the declarative structure rather than a human-readable page in Confluence
- I know which metrics are powered by which underlying events, which makes impact analysis easy when finding problems or making changes
- Talking about changes, I can do versioning
- I can easily diff the model so people can understand what the changes are from one release to another
- I can generate documentation in many different ways, depending on the audience, from technical to plain language
- I can move to different analytics packages in parallel without having to re-invent the wheel
- Reduce effort to describe analytics requirements - this can be very time consuming
- I can deploy changes to a tag manager, such as Google Tag Manager using the API as part of a build plan, without having to manage tags directly
- Increase speed of development - who’s to complain when it’s a lot more straightforward to implement?
- It can drive higher levels of consistency across analytics platforms (ie define once, reuse across multiple tools) because one analytics tracker is not enough
The point is, the value of writing up the event specification in something that is declarative gives me a flexible position to accelerate changes and meet high levels of quality.
Can’t you just use something like Segment?
Segment is a pretty cool idea, but I don’t think it’s a complete solution for Analytics. It can make a lot of the implementation simpler, but it doesn’t promote the same level of understanding and change management that’s still required in a rapidly developing analytics environment across all the different users of Analytics. Some analytics packages would require a special case of their own SDK, so I think a model of using Segment may not work for all trackers.
What are some challenges?
There are probably many which I haven’t encountered yet, but here’s a few things which strike me as problems from the start.
The tools just don’t really exist right now
Actually this isn’t completely true. Some tools do exist: you can use things like JSON, a schema validator, Git, and a bunch of other typical tools used to develop code. But the complete ecosystem doesn’t exist: there are significant gaps (opportunities?) around:
- Documentation generation
- Declaration-driven automated cross-platform functional analytics testing
- Data quality analysis and reporting driven by Analytics as Code definitions
- … and more
Semantic meaning of events is difficult to capture
When should the play event happen in relation to other events? How do we know if this is a semantically valid chain of events? Do you need to capture intent to purchase prior to actually purchasing?
This knowledge is essential to measure if the events are being captured correctly yet it is strikingly difficult to describe what’s “right”. Simple rules for data validation such as regex or name-value lists will only provide basic validation help. The nuance of what attributes are available when and in what scenarios is what defeats most descriptions of analytics requirements.
It’s hard to come up with a model that captures everything without over-complicating the solution
I could dream up a large number of aspects which the model needs to deal with, but some important things come to mind:
- Business KPIs or metrics (why are we tracking this?)
- Mapping or Translation Layer to a common model
- Semantically Described Behaviour
- Event Schema
- Versioning
- Trigger
- Compatible content types
- Compatible platforms
- Mandatory contexts (additional information which make the event more meaningful)
- Optional contexts with rules when to attach
- Data spec or schema
- Any additional useful notes
- Product or app status - does the product version have this version of the event implemented? Does it actually work and meet the spec using automatic status verification?
- Integration with tag managers, such as Google Tag Manager (GTM)
- Priorities: if you couldn’t implement ‘all the things’, what’s the basic minimum set of events required?
- Emitters - where do the events come from?
- Enrichment - how could the events be enriched with additional data to add meaning?
- Validation - what’s valid?
- Targets: connectors to analytics packages as destinations for analytics events
- … and then some.
Not all analytics tools will play nicely
I’m talking about you, Nielsen and Webtrends. Possibly others. There are a lot of analytics tools and packages out there and I’d say they would mostly want you to use their own SDKs with their own event definitions and triggers. But often this can be wrapped in reusuable libraries provided that the organisation has the appetite for such effort. And you don’t want to be calling the ‘collector’ endpoints directly with your own formed request because taking on that responsibility will only make the solution more brittle.
In this scenario, it could be worth identifying the packages which don’t work natively and at least having accurate information to reflect this. Not only will it mean documentation is correct, but anyone verifying the data at least has a solid reference point to compare with.
It takes a fair investment
This might be a hard sell in some organisations. And obviously at the other end of the scale this is not something for a 50 hits a day website which can’t justify the complexity and effort. Combine this with the slick marketing of most analytics tools as being “Shove this JavaScript code on your page and you’re done! Boom!” means it’s quite a difficult sell as to why it’s high effort.
Analytics is all about quality data, but sometimes you need to accept less-than-perfect data.
If you absolutely reject all data that doesn’t match the spec perfectly, you will most likely drop a huge amount of data and struggle to measure a lot of things. One philosophy of Snowplow Analytics is that no data is ever truly dropped. It can always be re-transformed, cleaned and processed later. Validation can be generally reported on the consumption end of the pipeline, rather than somewhere in the middle.
The main reason for doing this is getting products to emit perfectly formed events is really hard. If they are close to being correct, often that’s good enough. There are so many competing priorities that sometimes analytics can be treated like documentation or testing: shoved as a ’low’ priority ahead of features. Of course the amusing part of this is whenever a request is made to measure a new feature that can’t be measured (because analytics was not prioritised), there is suddenly a rush to fix up the tracking and release a new version.
Analytics as Code attempts to assist by making is so darn easy to implement that it’s crazy to not implement. Of course, it would be amazing to go a step further and be able to automatically track and measure the things that matter, but I think that’s too aspirational for now.
What can you do with decent data?
This goes for any analytics implementation but it helps to drive home why it’s so important. Here’s a few ideas:
- Justifying and optimising marketing spend. As much as I hate ads, you can’t just spend money randomly without justifying it.
- Business KPIs
- Product Feature Development - using the “quant” rather than qualitative research or even gut feel
- Data Science deep dives
- Recommender systems
- Machine learning all the things
What could be possible if dreams come true

This is super ambitious, but I can imagine big things are possible. For example, it should be possible to deploy analytics and tracking logic directly in digital products automatically based on the declarative definition of analytics events using Analytics as Code.
You could deploy changes, revise things and then ensure it works to an accepted level of quality without having to modify the product code base directly. Or at least you could aim to do this most of the time for non-breaking changes.
This would massively increase the coverage possible, open up new product analysis opportunities and reduce the time spent by products to implement analytics and tracking.
What’s next?
Actually doing the thing. Starting small. Building it up. Pausing every once in a while to make sure we’re heading in the right direction.
I’m hoping to have a working model and develop the idea out further to cover a fairly complex scenario with multiple teams and analytics solutions, which will be a good test to see if it holds up. I’d also like to put together some sort of master “Analytics Ecosystem” to describe how all the bits hang together.
What this actually means in practical terms is writing up a spec and eventually a schema to validate the spec is at least syntactically correct. And I’d say there would be more diagrams to draw as well.
Like this post? Subscribe to my RSS Feed ![]() or
or ![]() Buy me a coffee
Buy me a coffee
Comments are closed